
365 Healthy Food Guide
Explore Healthy Food Guide's analysis of 19 published 365 products, comparing Longevity and Food Integrity scores side by side. Rankings are calculated from the same scoring methods used on each individual product analysis, and every entry links to the underlying breakdown. This page covers the 365 products currently analyzed and published by Healthy Food Guide, not the full store catalog.
Dataset summary
- 365 products published
- 20
- Scored on both measures
- 19
- Median Longevity Score
- 72/100
- Median Food Integrity Score
- 84/100
- Scoring 80+ on both
- 3
- Categories covered
- 6
- Highest Longevity Score among the 19 currently analyzed 365 products: 365 Organic Silken Tofu — 96/100.
- Highest Food Integrity Score: 365 Organic Silken Tofu — 98/100.
- 3 of 19 analyzed products score at least 80 on both measures.
- Median scores across the analyzed set: Longevity 72/100, Food Integrity 84/100.
How the two scores differ
- Longevity Score
- Evaluates nutrition-related characteristics relevant to longer-term eating patterns. Longevity methodology
- Food Integrity Score
- Evaluates ingredient composition, processing and related ingredient-quality considerations. Food Integrity methodology
Food Integrity examines characteristics such as ingredients, processing and additive concerns, while Longevity evaluates nutrition-related characteristics associated with longer-term eating patterns. Because the two analyses answer different questions, a product can perform differently under each.
Highest Longevity Scores
Ranked by Longevity Score, then Food Integrity Score, then product name.
- Rank 1
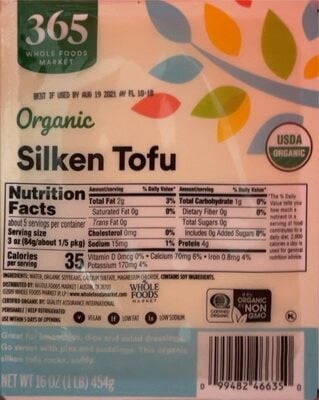
365 Organic Silken Tofu
Exceptional Choice
- Longevity Score
- 96/100
- Food Integrity Score
- 98/100
Longevity analysis for 365 Organic Silken TofuFood Integrity analysis for 365 Organic Silken Tofu
- Rank 2
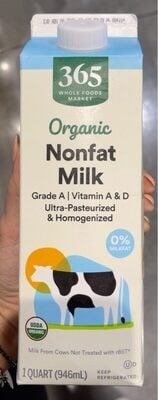
365 Organic Fat Free Milk, 1 Quart
Exceptional Choice
- Longevity Score
- 88/100
- Food Integrity Score
- 93/100
Longevity analysis for 365 Organic Fat Free Milk, 1 QuartFood Integrity analysis for 365 Organic Fat Free Milk, 1 Quart
- Rank 3
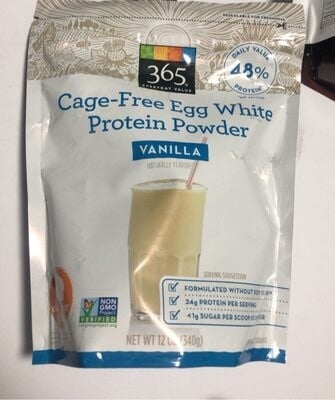
365 Vanilla Cage-Free Egg White Protein Powder
Choose Occasionally
- Longevity Score
- 88/100
- Food Integrity Score
- 68/100
Longevity analysis for 365 Vanilla Cage-Free Egg White Protein PowderFood Integrity analysis for 365 Vanilla Cage-Free Egg White Protein Powder
- Rank 4
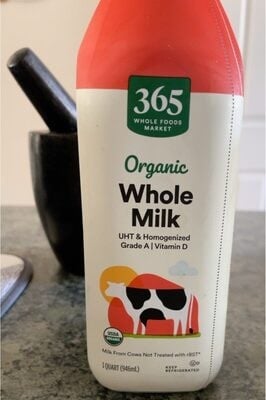
365 By Whole Foods Market Organic Whole Milk
Solid Choice
- Longevity Score
- 82/100
- Food Integrity Score
- 97/100
Longevity analysis for 365 By Whole Foods Market Organic Whole MilkFood Integrity analysis for 365 By Whole Foods Market Organic Whole Milk
- Rank 5
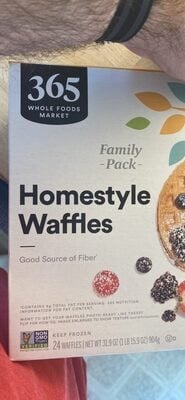
365 Homestyle Waffles
Enjoy in Moderation
- Longevity Score
- 78/100
- Food Integrity Score
- 78/100
Longevity analysis for 365 Homestyle WafflesFood Integrity analysis for 365 Homestyle Waffles
- Rank 6
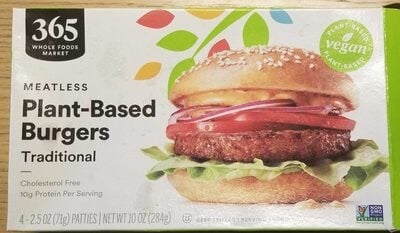
365 Traditional Meatless Plant-Based Burgers
Limit When Possible
- Longevity Score
- 76/100
- Food Integrity Score
- 52/100
Longevity analysis for 365 Traditional Meatless Plant-Based BurgersFood Integrity analysis for 365 Traditional Meatless Plant-Based Burgers
- Rank 7
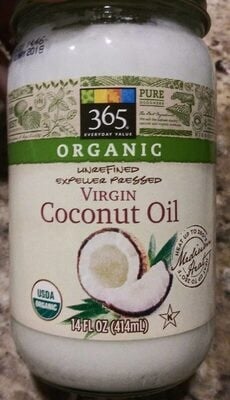
365 Unrefined Virgin Coconut Oil
Solid Choice
- Longevity Score
- 72/100
- Food Integrity Score
- 96/100
Longevity analysis for 365 Unrefined Virgin Coconut OilFood Integrity analysis for 365 Unrefined Virgin Coconut Oil
- Rank 8
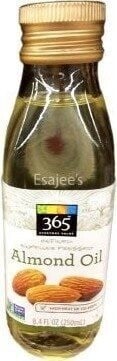
365 Everyday Value, Almond Oil
Enjoy in Moderation
- Longevity Score
- 72/100
- Food Integrity Score
- 84/100
Longevity analysis for 365 Everyday Value, Almond OilFood Integrity analysis for 365 Everyday Value, Almond Oil
- Rank 9
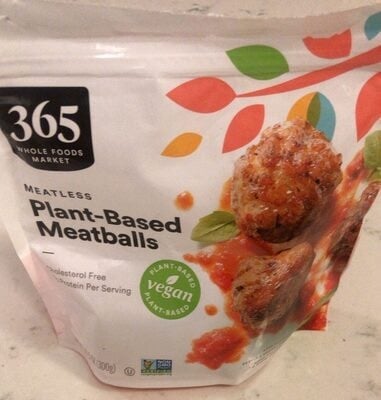
365 Meatless Plant-Based Meatballs
Choose Occasionally
- Longevity Score
- 72/100
- Food Integrity Score
- 62/100
Longevity analysis for 365 Meatless Plant-Based MeatballsFood Integrity analysis for 365 Meatless Plant-Based Meatballs
- Rank 10
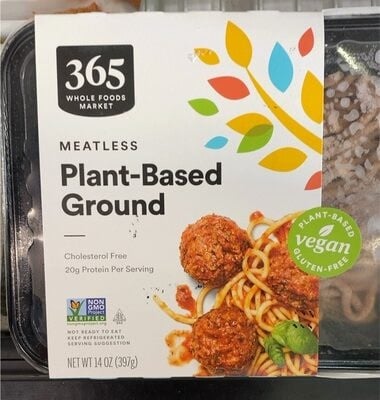
365 Meatless Plant-Based Ground
Limit When Possible
- Longevity Score
- 72/100
- Food Integrity Score
- 52/100
Longevity analysis for 365 Meatless Plant-Based GroundFood Integrity analysis for 365 Meatless Plant-Based Ground
Highest Food Integrity Scores
Ranked by Food Integrity Score, then Longevity Score, then product name.
- Rank 1
365 Organic Silken Tofu
Exceptional Choice
- Longevity Score
- 96/100
- Food Integrity Score
- 98/100
Longevity analysis for 365 Organic Silken TofuFood Integrity analysis for 365 Organic Silken Tofu
- Rank 2
365 By Whole Foods Market Organic Whole Milk
Solid Choice
- Longevity Score
- 82/100
- Food Integrity Score
- 97/100
Longevity analysis for 365 By Whole Foods Market Organic Whole MilkFood Integrity analysis for 365 By Whole Foods Market Organic Whole Milk
- Rank 3
365 Unrefined Virgin Coconut Oil
Solid Choice
- Longevity Score
- 72/100
- Food Integrity Score
- 96/100
Longevity analysis for 365 Unrefined Virgin Coconut OilFood Integrity analysis for 365 Unrefined Virgin Coconut Oil
- Rank 4
365 Organic Fat Free Milk, 1 Quart
Exceptional Choice
- Longevity Score
- 88/100
- Food Integrity Score
- 93/100
Longevity analysis for 365 Organic Fat Free Milk, 1 QuartFood Integrity analysis for 365 Organic Fat Free Milk, 1 Quart
- Rank 5
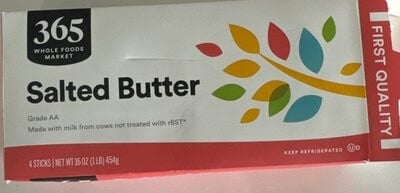
365 Butter, Salted 4 Quarters
Choose Occasionally
- Longevity Score
- 62/100
- Food Integrity Score
- 93/100
Longevity analysis for 365 Butter, Salted 4 QuartersFood Integrity analysis for 365 Butter, Salted 4 Quarters
- Rank 6
365 Everyday Value, Almond Oil
Enjoy in Moderation
- Longevity Score
- 72/100
- Food Integrity Score
- 84/100
Longevity analysis for 365 Everyday Value, Almond OilFood Integrity analysis for 365 Everyday Value, Almond Oil
- Rank 7
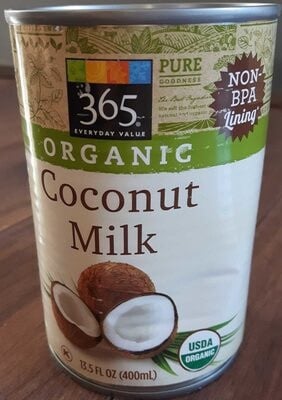
365 Organic Coconut Milk
Choose Occasionally
- Longevity Score
- 62/100
- Food Integrity Score
- 84/100
Longevity analysis for 365 Organic Coconut MilkFood Integrity analysis for 365 Organic Coconut Milk
- Rank 8
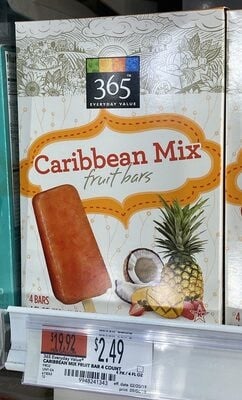
365 Caribbean Mix Fruit Bars
Limit When Possible
- Longevity Score
- 48/100
- Food Integrity Score
- 84/100
Longevity analysis for 365 Caribbean Mix Fruit BarsFood Integrity analysis for 365 Caribbean Mix Fruit Bars
- Rank 9
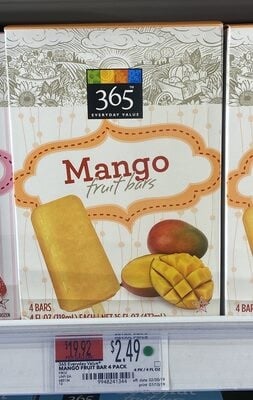
365 Mango Fruit Bars
Limit When Possible
- Longevity Score
- 48/100
- Food Integrity Score
- 84/100
Longevity analysis for 365 Mango Fruit BarsFood Integrity analysis for 365 Mango Fruit Bars
- Rank 10
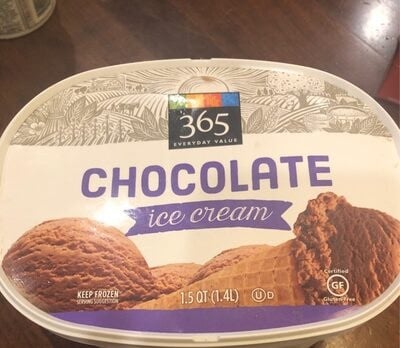
365 Chocolate Ice Cream
Consider Avoiding
- Longevity Score
- 38/100
- Food Integrity Score
- 84/100
Longevity analysis for 365 Chocolate Ice CreamFood Integrity analysis for 365 Chocolate Ice Cream
Strong Across Both Scores
Ranked by the weaker of the two scores.
Products in this section perform strongly under both Healthy Food Guide scoring lenses; ranking favors the weaker of the two scores so a very high result in one dimension does not conceal a substantially lower result in the other.
- Rank 1
365 Organic Silken Tofu
Exceptional Choice
- Longevity Score
- 96/100
- Food Integrity Score
- 98/100
Longevity analysis for 365 Organic Silken TofuFood Integrity analysis for 365 Organic Silken Tofu
- Rank 2
365 Organic Fat Free Milk, 1 Quart
Exceptional Choice
- Longevity Score
- 88/100
- Food Integrity Score
- 93/100
Longevity analysis for 365 Organic Fat Free Milk, 1 QuartFood Integrity analysis for 365 Organic Fat Free Milk, 1 Quart
- Rank 3
365 By Whole Foods Market Organic Whole Milk
Solid Choice
- Longevity Score
- 82/100
- Food Integrity Score
- 97/100
Longevity analysis for 365 By Whole Foods Market Organic Whole MilkFood Integrity analysis for 365 By Whole Foods Market Organic Whole Milk
- Rank 4
365 Homestyle Waffles
Enjoy in Moderation
- Longevity Score
- 78/100
- Food Integrity Score
- 78/100
Longevity analysis for 365 Homestyle WafflesFood Integrity analysis for 365 Homestyle Waffles
- Rank 5
365 Unrefined Virgin Coconut Oil
Solid Choice
- Longevity Score
- 72/100
- Food Integrity Score
- 96/100
Longevity analysis for 365 Unrefined Virgin Coconut OilFood Integrity analysis for 365 Unrefined Virgin Coconut Oil
- Rank 6
365 Everyday Value, Almond Oil
Enjoy in Moderation
- Longevity Score
- 72/100
- Food Integrity Score
- 84/100
Longevity analysis for 365 Everyday Value, Almond OilFood Integrity analysis for 365 Everyday Value, Almond Oil
- Rank 7
365 Vanilla Cage-Free Egg White Protein Powder
Choose Occasionally
- Longevity Score
- 88/100
- Food Integrity Score
- 68/100
Longevity analysis for 365 Vanilla Cage-Free Egg White Protein PowderFood Integrity analysis for 365 Vanilla Cage-Free Egg White Protein Powder
- Rank 8
365 Butter, Salted 4 Quarters
Choose Occasionally
- Longevity Score
- 62/100
- Food Integrity Score
- 93/100
Longevity analysis for 365 Butter, Salted 4 QuartersFood Integrity analysis for 365 Butter, Salted 4 Quarters
- Rank 9
365 Organic Coconut Milk
Choose Occasionally
- Longevity Score
- 62/100
- Food Integrity Score
- 84/100
Longevity analysis for 365 Organic Coconut MilkFood Integrity analysis for 365 Organic Coconut Milk
- Rank 10
365 Meatless Plant-Based Meatballs
Choose Occasionally
- Longevity Score
- 72/100
- Food Integrity Score
- 62/100
Longevity analysis for 365 Meatless Plant-Based MeatballsFood Integrity analysis for 365 Meatless Plant-Based Meatballs
Where Longevity and Food Integrity Differ
Ranked by the size of the gap between the two scores.
Longevity and Food Integrity measure different characteristics, so some foods can score very differently depending on whether nutrition patterns or ingredient and processing characteristics are emphasized. Neither score is the correct one — they answer different questions.
- Rank 1
365 Chocolate Ice Cream
Consider Avoiding
- Longevity Score
- 38/100
- Food Integrity Score
- 84/100
- Score difference
- 46 points
Longevity analysis for 365 Chocolate Ice CreamFood Integrity analysis for 365 Chocolate Ice Cream
- Rank 2
365 Caribbean Mix Fruit Bars
Limit When Possible
- Longevity Score
- 48/100
- Food Integrity Score
- 84/100
- Score difference
- 36 points
Longevity analysis for 365 Caribbean Mix Fruit BarsFood Integrity analysis for 365 Caribbean Mix Fruit Bars
- Rank 3
365 Mango Fruit Bars
Limit When Possible
- Longevity Score
- 48/100
- Food Integrity Score
- 84/100
- Score difference
- 36 points
Longevity analysis for 365 Mango Fruit BarsFood Integrity analysis for 365 Mango Fruit Bars
- Rank 4
365 Butter, Salted 4 Quarters
Choose Occasionally
- Longevity Score
- 62/100
- Food Integrity Score
- 93/100
- Score difference
- 31 points
Longevity analysis for 365 Butter, Salted 4 QuartersFood Integrity analysis for 365 Butter, Salted 4 Quarters
- Rank 5
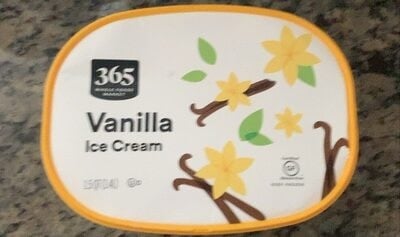
365 Vanilla Ice Cream
Limit When Possible
- Longevity Score
- 48/100
- Food Integrity Score
- 74/100
- Score difference
- 26 points
Longevity analysis for 365 Vanilla Ice CreamFood Integrity analysis for 365 Vanilla Ice Cream
- Rank 6
365 Traditional Meatless Plant-Based Burgers
Limit When Possible
- Longevity Score
- 76/100
- Food Integrity Score
- 52/100
- Score difference
- 24 points
Longevity analysis for 365 Traditional Meatless Plant-Based BurgersFood Integrity analysis for 365 Traditional Meatless Plant-Based Burgers
- Rank 7
365 Unrefined Virgin Coconut Oil
Solid Choice
- Longevity Score
- 72/100
- Food Integrity Score
- 96/100
- Score difference
- 24 points
Longevity analysis for 365 Unrefined Virgin Coconut OilFood Integrity analysis for 365 Unrefined Virgin Coconut Oil
- Rank 8
365 Organic Coconut Milk
Choose Occasionally
- Longevity Score
- 62/100
- Food Integrity Score
- 84/100
- Score difference
- 22 points
Longevity analysis for 365 Organic Coconut MilkFood Integrity analysis for 365 Organic Coconut Milk
Leading 365 products at a glance
| Product | Longevity Score | Food Integrity Score | Category |
|---|---|---|---|
| 365 Organic Silken Tofu | 96/100 | 98/100 | Meat & Poultry |
| 365 Organic Fat Free Milk, 1 Quart | 88/100 | 93/100 | Dairy |
| 365 By Whole Foods Market Organic Whole Milk | 82/100 | 97/100 | Dairy |
| 365 Homestyle Waffles | 78/100 | 78/100 | Breakfast & Cereal |
| 365 Unrefined Virgin Coconut Oil | 72/100 | 96/100 | Pantry & Oils |
| 365 Everyday Value, Almond Oil | 72/100 | 84/100 | Pantry & Oils |
| 365 Vanilla Cage-Free Egg White Protein Powder | 88/100 | 68/100 | Snacks |
| 365 Butter, Salted 4 Quarters | 62/100 | 93/100 | Dairy |
| 365 Organic Coconut Milk | 62/100 | 84/100 | Dairy |
| 365 Meatless Plant-Based Meatballs | 72/100 | 62/100 | Meat & Poultry |
365 highlights by category
Categories with enough analyzed products to compare. Ordering favors the weaker of the two scores.
Ice Cream & Frozen Desserts (6 analyzed)
- Rank 1
365 Caribbean Mix Fruit Bars
Limit When Possible
- Longevity Score
- 48/100
- Food Integrity Score
- 84/100
Longevity analysis for 365 Caribbean Mix Fruit BarsFood Integrity analysis for 365 Caribbean Mix Fruit Bars
- Rank 2
365 Mango Fruit Bars
Limit When Possible
- Longevity Score
- 48/100
- Food Integrity Score
- 84/100
Longevity analysis for 365 Mango Fruit BarsFood Integrity analysis for 365 Mango Fruit Bars
- Rank 3
365 Vanilla Ice Cream
Limit When Possible
- Longevity Score
- 48/100
- Food Integrity Score
- 74/100
Longevity analysis for 365 Vanilla Ice CreamFood Integrity analysis for 365 Vanilla Ice Cream
- Rank 4
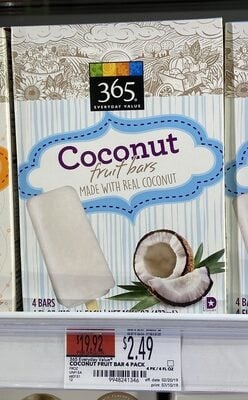
365 Coconut Fruit Bars
Limit When Possible
- Longevity Score
- 48/100
- Food Integrity Score
- 62/100
Longevity analysis for 365 Coconut Fruit BarsFood Integrity analysis for 365 Coconut Fruit Bars
- Rank 5
365 Chocolate Ice Cream
Consider Avoiding
- Longevity Score
- 38/100
- Food Integrity Score
- 84/100
Longevity analysis for 365 Chocolate Ice CreamFood Integrity analysis for 365 Chocolate Ice Cream
Dairy (5 analyzed)
- Rank 1
365 Organic Fat Free Milk, 1 Quart
Exceptional Choice
- Longevity Score
- 88/100
- Food Integrity Score
- 93/100
Longevity analysis for 365 Organic Fat Free Milk, 1 QuartFood Integrity analysis for 365 Organic Fat Free Milk, 1 Quart
- Rank 2
365 By Whole Foods Market Organic Whole Milk
Solid Choice
- Longevity Score
- 82/100
- Food Integrity Score
- 97/100
Longevity analysis for 365 By Whole Foods Market Organic Whole MilkFood Integrity analysis for 365 By Whole Foods Market Organic Whole Milk
- Rank 3
365 Butter, Salted 4 Quarters
Choose Occasionally
- Longevity Score
- 62/100
- Food Integrity Score
- 93/100
Longevity analysis for 365 Butter, Salted 4 QuartersFood Integrity analysis for 365 Butter, Salted 4 Quarters
- Rank 4
365 Organic Coconut Milk
Choose Occasionally
- Longevity Score
- 62/100
- Food Integrity Score
- 84/100
Longevity analysis for 365 Organic Coconut MilkFood Integrity analysis for 365 Organic Coconut Milk
- Rank 5
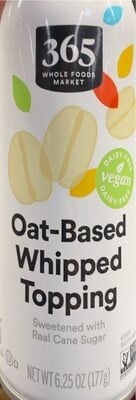
365 Oat- Based Whipped Topping
Limit When Possible
- Longevity Score
- 62/100
- Food Integrity Score
- 47/100
Longevity analysis for 365 Oat- Based Whipped ToppingFood Integrity analysis for 365 Oat- Based Whipped Topping
All analyzed products from 365
19 analyzed products, ranked by balanced score (weaker of Longevity and Food Integrity scores). Plus 1 published product awaiting complete analysis data.
- 365 Organic Silken TofuLongevity Score 96/100 · Food Integrity Score 98/100Longevity analysis for 365 Organic Silken Tofu · Food Integrity analysis for 365 Organic Silken Tofu
- 365 Organic Fat Free Milk, 1 QuartLongevity Score 88/100 · Food Integrity Score 93/100Longevity analysis for 365 Organic Fat Free Milk, 1 Quart · Food Integrity analysis for 365 Organic Fat Free Milk, 1 Quart
- 365 By Whole Foods Market Organic Whole MilkLongevity Score 82/100 · Food Integrity Score 97/100Longevity analysis for 365 By Whole Foods Market Organic Whole Milk · Food Integrity analysis for 365 By Whole Foods Market Organic Whole Milk
- 365 Homestyle WafflesLongevity Score 78/100 · Food Integrity Score 78/100Longevity analysis for 365 Homestyle Waffles · Food Integrity analysis for 365 Homestyle Waffles
- 365 Unrefined Virgin Coconut OilLongevity Score 72/100 · Food Integrity Score 96/100Longevity analysis for 365 Unrefined Virgin Coconut Oil · Food Integrity analysis for 365 Unrefined Virgin Coconut Oil
- 365 Everyday Value, Almond OilLongevity Score 72/100 · Food Integrity Score 84/100Longevity analysis for 365 Everyday Value, Almond Oil · Food Integrity analysis for 365 Everyday Value, Almond Oil
- 365 Vanilla Cage-Free Egg White Protein PowderLongevity Score 88/100 · Food Integrity Score 68/100Longevity analysis for 365 Vanilla Cage-Free Egg White Protein Powder · Food Integrity analysis for 365 Vanilla Cage-Free Egg White Protein Powder
- 365 Butter, Salted 4 QuartersLongevity Score 62/100 · Food Integrity Score 93/100Longevity analysis for 365 Butter, Salted 4 Quarters · Food Integrity analysis for 365 Butter, Salted 4 Quarters
- 365 Organic Coconut MilkLongevity Score 62/100 · Food Integrity Score 84/100Longevity analysis for 365 Organic Coconut Milk · Food Integrity analysis for 365 Organic Coconut Milk
- 365 Meatless Plant-Based MeatballsLongevity Score 72/100 · Food Integrity Score 62/100Longevity analysis for 365 Meatless Plant-Based Meatballs · Food Integrity analysis for 365 Meatless Plant-Based Meatballs
- 365 Traditional Meatless Plant-Based BurgersLongevity Score 76/100 · Food Integrity Score 52/100Longevity analysis for 365 Traditional Meatless Plant-Based Burgers · Food Integrity analysis for 365 Traditional Meatless Plant-Based Burgers
- 365 Meatless Plant-Based GroundLongevity Score 72/100 · Food Integrity Score 52/100Longevity analysis for 365 Meatless Plant-Based Ground · Food Integrity analysis for 365 Meatless Plant-Based Ground
- 365 Caribbean Mix Fruit BarsLongevity Score 48/100 · Food Integrity Score 84/100Longevity analysis for 365 Caribbean Mix Fruit Bars · Food Integrity analysis for 365 Caribbean Mix Fruit Bars
- 365 Mango Fruit BarsLongevity Score 48/100 · Food Integrity Score 84/100Longevity analysis for 365 Mango Fruit Bars · Food Integrity analysis for 365 Mango Fruit Bars
- 365 Vanilla Ice CreamLongevity Score 48/100 · Food Integrity Score 74/100Longevity analysis for 365 Vanilla Ice Cream · Food Integrity analysis for 365 Vanilla Ice Cream
- 365 Coconut Fruit BarsLongevity Score 48/100 · Food Integrity Score 62/100Longevity analysis for 365 Coconut Fruit Bars · Food Integrity analysis for 365 Coconut Fruit Bars
- 365 Oat- Based Whipped ToppingLongevity Score 62/100 · Food Integrity Score 47/100Longevity analysis for 365 Oat- Based Whipped Topping · Food Integrity analysis for 365 Oat- Based Whipped Topping
- 365 Chocolate Ice CreamLongevity Score 38/100 · Food Integrity Score 84/100Longevity analysis for 365 Chocolate Ice Cream · Food Integrity analysis for 365 Chocolate Ice Cream
- 365 Cookie Dough Ice CreamLongevity Score 28/100 · Food Integrity Score 47/100Longevity analysis for 365 Cookie Dough Ice Cream · Food Integrity analysis for 365 Cookie Dough Ice Cream
About this dataset
This page represents the 19 365 products currently analyzed and published in Healthy Food Guide. Underlying nutrition and ingredient information comes from the data sources identified on each individual product page.
Rankings include products with sufficient data for the applicable Healthy Food Guide analysis.
Data sources & safety information
Last updated (latest verified update across the analyzed 365 products).