
Healthy Food Guide by KarbCoach
Cap'n Crunch Sweetend Corn & Oat Cereal: Longevity analysis
Quick answer
Special Occasion Choice
Cap'n Crunch sweetend corn & oat cereal received a Longevity Score of 22 out of 100 (special occasion choice). Refined corn and oat flour with sugar, artificial colors, and BHT; low fiber and protein for a sweetened cereal. Strengths include oat flour provides some whole-grain content and fortified with b vitamins and iron, while main considerations include 17g sugar per cup, mostly added sugar, artificial colors yellow 5 and yellow 6, and bht preservative and multiple additives.
Longevity Score 22/100
What helped the score?
- Oat flour provides some whole-grain content
- Fortified with B vitamins and iron
What held the score back?
- 17g sugar per cup, mostly added sugar
- Artificial colors Yellow 5 and Yellow 6
- BHT preservative and multiple additives
You are viewing the nutrition and longevity perspective. Switch to Food Integrity for ingredients and processing.
Source data, GTIN, and Healthy Food Guide analysis details
Product facts
- Product
- Cap'n Crunch Sweetend Corn & Oat Cereal
- Brand
- Cap'n Crunch
- Category
- Breakfast & Cereal (source: Cereal)
- GTIN / UPC
00030000317525- Serving size
- 38 g (1 cup)
- Source data — ingredients
- Ingredient list from product label data (see Sources)
- Healthy Food Guide analysis
- Independent Longevity and Food Integrity scorecards. See methodology under Sources.
- Data last verified
Cap'n Crunch
Sweetend Corn & Oat Cereal
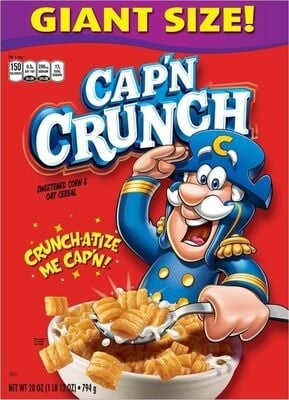
KarbCoach Recommendation
Special Occasion Choice
Refined corn and oat flour with sugar, artificial colors, and BHT; low fiber and protein for a sweetened cereal.
What Stands Out
Low Fiber
1g fiber
4% DVHigh Added Sugar
15g added sugar
30% DVRefined Grains
Refined corn flour
Artificial Colors
Yellow 5
Added Sweetener
Sugar
DV = Percent of Daily Value based on a 2,000 calorie diet
Key Positives
- Oat flour provides some whole-grain content
- Fortified with B vitamins and iron
Key Concerns
- 17g sugar per cup, mostly added sugar
- Artificial colors Yellow 5 and Yellow 6
- BHT preservative and multiple additives
- Refined flours with only about 1g fiber
Ingredient Signals
Whole-food ingredients
Processing signals
Additives
Artificial colors
Added sweeteners
Ingredients
Ingredient list
CORN FLOUR, SUGAR, OAT FLOUR, BROWN SUGAR, PALM AND/OR COCONUT OIL, SALT, REDUCED IRON, YELLOW 5, NIACINAMIDE*, YELLOW 6, BHT (TO PRESERVE FRESHNESS), THIAMINE MONONITRATE*, PYRIDOXINE HYDROCHLORIDE*, RIBOFLAVIN*, FOLIC ACID*.
Formulations can vary — check the package label for the final word.
Macronutrients
Calories
150
8% DVTotal Carbs
33g
12% DVProtein
2g
4% DVSaturated Fat
0.5g
3% DVFiber
1g
4% DVNet Carbs
32g
12% DVSugar
17g
Added Sugar
15g
30% DVTotal Fat
2g
3% DVSodium
290mg
13% DVCholesterol
0mg
0% DVUnsaturated Fat
1.5g
DV = Percent of Daily Value based on a 2,000 calorie diet
Nutrition at a Glance
| Nutrient | Amount | % Daily Value |
|---|---|---|
| Calories | 150 | 8% DV |
| Total Carbs | 33g | 12% DV |
| Protein | 2g | 4% DV |
| Saturated Fat | 0.5g | 3% DV |
| Fiber | 1g | 4% DV |
| Net Carbs | 32g | 12% DV |
| Sugar | 17g | — |
| Added Sugar | 15g | 30% DV |
| Total Fat | 2g | 3% DV |
| Sodium | 290mg | 13% DV |
| Cholesterol | 0mg | 0% DV |
| Unsaturated Fat | 1.5g | — |
DV = Percent of Daily Value based on a 2,000 calorie diet
Amounts are per labeled serving from source data. Check the package for the final values.
Longevity scores estimate how this product’s nutrition and ingredient profile fit longer-term eating patterns. Formulations can vary — check the package label. Not medical advice. Some nutrient values may be estimated when the label is incomplete.
How this product may fit different goals
The same food can look different depending on what matters most to you. Here is a general preview of how this product may align with several common goals.
Low-Spike Stability
Watch-outsMetabolic Health
For someone prioritizing Low-Spike Stability, the analysis identifies considerations that may matter more than the general product score alone.
A consideration: Higher net carbs (32g)
This product has 3 additional signals for this goal.
Heart-Healthy Eating
SupportiveMetabolic Health
For someone prioritizing Heart-Healthy Eating, the available data suggest this product may align in helpful ways.
A supportive signal: Low saturated fat (0.5g)
GLP-1 Eating Support
Watch-outsMetabolic Health
For someone prioritizing GLP-1 Eating Support, the analysis identifies considerations that may matter more than the general product score alone.
A consideration: Lower protein (2g)
This product has 1 additional signal for this goal.
Low Sugar Lifestyle
Watch-outsMetabolic Health
For someone prioritizing Low Sugar Lifestyle, the analysis identifies considerations that may matter more than the general product score alone.
A consideration: Higher sugar (17g)
This product has 2 additional signals for this goal.
Appetite & Portion Awareness
MixedMetabolic Health
For someone prioritizing Appetite & Portion Awareness, the same nutrition and ingredient data show both supportive signals and tradeoffs.
A tradeoff: Higher sugar (17g)
This product has 1 additional signal for this goal.
Athletic Fueling
Watch-outsAthletic Performance
For someone prioritizing Athletic Fueling, the analysis identifies considerations that may matter more than the general product score alone.
A consideration: Carbohydrate is almost entirely sugar (17g of 33g carbs)
Workout Recovery
Watch-outsAthletic Performance
For someone prioritizing Workout Recovery, the analysis identifies considerations that may matter more than the general product score alone.
A consideration: Lower protein (2g)
Strength & Protein Focus
Watch-outsAthletic Performance
For someone prioritizing Strength & Protein Focus, the analysis identifies considerations that may matter more than the general product score alone.
A consideration: Lower protein (2g)
Vegetarian
SupportiveDietary Patterns
For someone prioritizing Vegetarian, the available data suggest this product may align in helpful ways.
A supportive signal: Plant-food ingredients (Mentions "oat". See ingredients for details.)
Vegan
SupportiveDietary Patterns
For someone prioritizing Vegan, the available data suggest this product may align in helpful ways.
A supportive signal: Plant-food ingredients (Mentions "oat". See ingredients for details.)
Plant-Based
SupportiveDietary Patterns
For someone prioritizing Plant-Based, the available data suggest this product may align in helpful ways.
A supportive signal: Plant-food ingredients (Mentions "oat". See ingredients for details.)
Low-Carb Lifestyle
Watch-outsDietary Patterns
For someone prioritizing Low-Carb Lifestyle, the analysis identifies considerations that may matter more than the general product score alone.
A consideration: Higher net carbs (32g)
This product has 1 additional signal for this goal.
Keto-Style Eating
Watch-outsDietary Patterns
For someone prioritizing Keto-Style Eating, the analysis identifies considerations that may matter more than the general product score alone.
A consideration: Net carbs above typical keto snack range (32g)
This product has 1 additional signal for this goal.
Minimally Processed Eating
Watch-outsDietary Patterns
For someone prioritizing Minimally Processed Eating, the analysis identifies considerations that may matter more than the general product score alone.
A consideration: Sweetener signals (Sugar, Brown sugar)
This product has 1 additional signal for this goal.
Whole-Food Focused Eating
Watch-outsDietary Patterns
For someone prioritizing Whole-Food Focused Eating, the analysis identifies considerations that may matter more than the general product score alone.
A consideration: Sweetener signals (Sugar, Brown sugar)
This product has 1 additional signal for this goal.
Reduce Ultra-Processed Foods
Watch-outsDietary Patterns
For someone prioritizing Reduce Ultra-Processed Foods, the analysis identifies considerations that may matter more than the general product score alone.
A consideration: Sweetener signals (Sugar, Brown sugar)
This product has 1 additional signal for this goal.
Paleo-Style Eating
Watch-outsDietary Patterns
For someone prioritizing Paleo-Style Eating, the analysis identifies considerations that may matter more than the general product score alone.
A consideration: Grain/legume ingredients (Mentions "flour", "oat", "corn". See ingredients for details.)
This product has 1 additional signal for this goal.
Pescatarian
NeutralDietary Patterns
For someone prioritizing Pescatarian, the Longevity data do not show a strong matching signal for this product.
Low Gluten Eating
NeutralDietary Patterns
For someone prioritizing Low Gluten Eating, the Longevity data do not show a strong matching signal for this product.
Mediterranean-Style Eating
NeutralDietary Patterns
For someone prioritizing Mediterranean-Style Eating, the Longevity data do not show a strong matching signal for this product.
Healthy Fat Focus
NeutralDietary Patterns
For someone prioritizing Healthy Fat Focus, the Longevity data do not show a strong matching signal for this product.
See how this product fits your goals
Choose what matters most to you and explore a more detailed interpretation of this product's nutrition, ingredients, and tradeoffs.
Understanding the Longevity analysis
What the Longevity analysis evaluates
The Longevity analysis looks at how a food fits broader dietary patterns over time. It combines nutritional composition with processing and ingredient-quality considerations, including ideas that originated in Meal Power Points and Food Integrity. The Longevity Score summarizes that wider picture on a 0–100 scale. It is educational context for packaged foods, not medical advice and not a guarantee of health outcomes.
Nutrients, balance, processing, and ingredients
Nutritional composition matters: protein, fiber, carbohydrates, glucose-related characteristics, fats, sodium, and micronutrients all influence how a food may support or challenge different dietary goals. Processing level and ingredient quality still count, because formulation can change the practical meaning of an otherwise tidy nutrient panel. Longevity treats those dimensions together rather than as a single nutrient number.
Who may prioritize Longevity
People following low-carbohydrate, keto-style, high-protein, glucose-conscious, or longevity-focused eating patterns often start with the Longevity analysis. It is also useful when you want one place that connects macros and micros with how processed the food is and how the ingredient list reads. The Longevity Score is designed for that broader comparison across products.
How Longevity differs from Food Integrity
Food Integrity is the focused analysis of processing, ingredients, additives, purity, and transparency. Longevity is the broader analysis of nutritional composition, metabolic and dietary characteristics, processing, and ingredient quality. A strong nutritional profile may still deserve closer Food Integrity review when additives, oils, sweeteners, or processing level raise questions the nutrient panel does not answer on its own.
Why the analyses overlap—and why to review both
The overlap is intentional. Food Integrity–related characteristics contribute to Longevity, while Food Integrity remains separately useful for deeper formulation detail. The two views are meant to complement each other, not cancel each other out. Some people reasonably prioritize one analysis based on their goals; reviewing both can reveal tradeoffs that one score alone may not show.
Common questions about this product
Is Cap'n Crunch Sweetend Corn & Oat Cereal highly processed?
Food Integrity lists processing level as Highly processed. That reflects formulation and processing signals from the ingredient analysis — not a medical or regulatory classification.
Why are the Longevity and Food Integrity scores different?
Longevity emphasizes nutrition per serving and longer-term dietary alignment. Food Integrity emphasizes ingredients, additives, processing, and label transparency. The same product can score differently on those lenses.
How much fiber is in one serving?
Cap'n Crunch Sweetend Corn & Oat Cereal shows about 0.99g of fiber per labeled serving in the Longevity nutrition facts.
Does it contain added sugar?
Cap'n Crunch Sweetend Corn & Oat Cereal: 15g added sugar per serving; sweetener signals include Sugar, Brown sugar. Confirm the current package Nutrition Facts and ingredient list.
What helped the Longevity Score?
Key positives called out in the analysis include: Oat flour provides some whole-grain content; Fortified with B vitamins and iron.
What prevented a perfect Longevity Score?
Key concerns noted include: 17g sugar per cup, mostly added sugar; Artificial colors Yellow 5 and Yellow 6; BHT preservative and multiple additives.
Who might evaluate this product differently?
People prioritizing different goals (for example lower carbs, higher protein, or minimally processed eating) may weigh the same breakfast & cereal differently. Use the goal preview on this page, then personalize in KarbCoach for your priorities.
Source data and Healthy Food Guide analysis
- Public label databases (including USDA FoodData Central and Open Food Facts) — Possible sources for package ingredients and nutrition.
- Healthy Food Guide analysis (Longevity and Food Integrity) — Independent Longevity and Food Integrity scorecards.
- How the Longevity Score is calculated
- How the Food Integrity Score is calculated
- Scoring models: KarbCoach Longevity and Food Integrity.
- Independent analysis. No manufacturer affiliation.
- Formulations can vary by region, size, and packaging. Check the package label for ingredients, allergens, and nutrition. Not medical advice — do not use this site or the KarbCoach mobile app for allergy or health decisions. Full sources and safety details.
Label accuracy and safety information
Formulations can vary by region, size, and packaging. Check the package label for ingredients, allergens, and nutrition. Not medical advice — do not use this site or the KarbCoach mobile app for allergy or health decisions.
See how this item lines up with your goals
Healthy Food Guide covers this product in detail. In KarbCoach, your goals shape what matters most for your meals.
Also available in the app